

You measure agentic AI ROI by pairing rigorous pre-deployment baselines with a three-tier framework that captures operational efficiency, quality and experience, and strategic transformation. Then, convert outcomes into CFO-ready metrics: automation rate, cost per resolved task, time saved in FTEs, accuracy, and adoption. This approach avoids the pilot-to-value gap that trips up many programs.
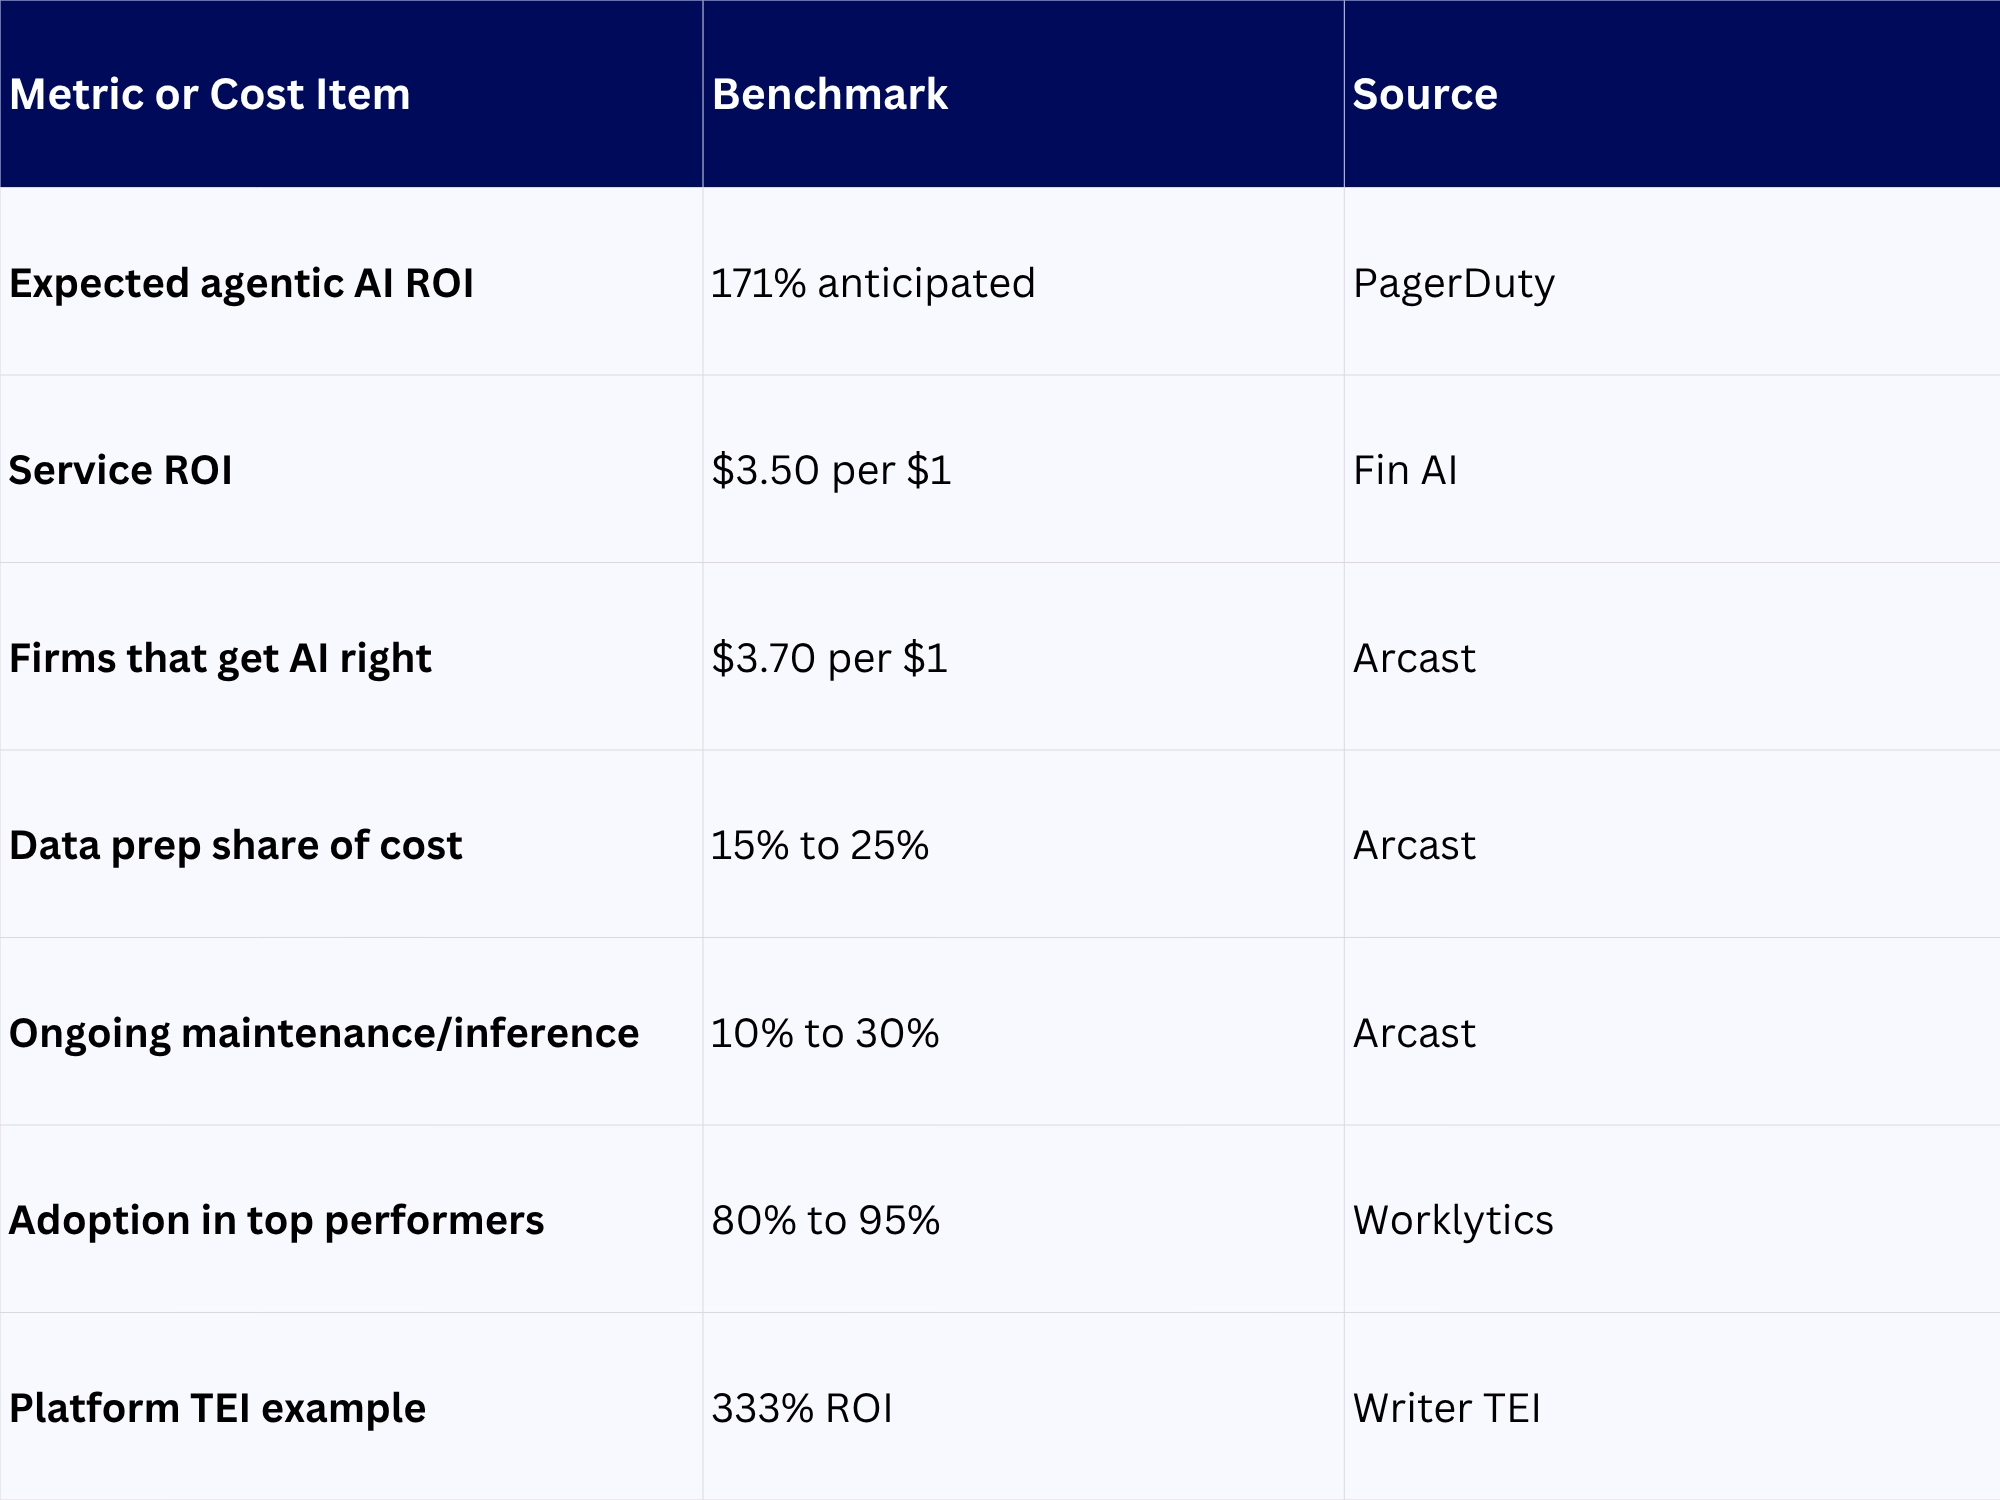
The stakes are high. More than half of companies have deployed AI agents and 62% expect returns greater than 100%, averaging 171% when measured correctly, yet many pilots still fail to show impact within six months PagerDuty UC Berkeley Exec Ed. This tutorial gives you a practical, step-by-step playbook with formulas, worked examples, and validated benchmarks. You can implement it immediately, and CT Labs can automate measurement through workflow-first design, governance, and observability.
Key Takeaways
- Use a three-tier framework to measure agentic AI value, not just cost cuts. 62% of companies expect >100% returns, with an average 171% anticipated ROI when measured broadly PagerDuty.
- Avoid short-term-only assessments. 95% of generative AI pilots failed to show measurable bottom-line impact within six months, so set realistic windows and track quality and strategic gains too UC Berkeley Exec Ed.
- Treat knowledge quality as the biggest multiplier. Data-mature enterprises report 2 to 3 times higher productivity and financial returns than peers with fragmented knowledge Semarchy.
Why Traditional ROI Models Fail for Agentic AI (And What's Different in 2026)
Traditional ROI models were built for deterministic software that follows scripts and delivers linear cost reductions. Agentic AI reasons across systems, adapts to context, and drives cross-functional outcomes that standard cost formulas miss. That mismatch is why many programs underreport value or look like failures.
The gap is visible in outcomes. Between 70 and 95% of AI projects struggle to show clear business impact when judged by narrow, short-term metrics The Data Experts. In fact, 95% of generative pilots failed to show bottom-line impact inside six months UC Berkeley Exec Ed.
Yet adoption and confidence are rising. More than half of companies have already deployed AI agents and 62% expect returns greater than 100%, with an average anticipated ROI of 171% PagerDuty. McKinsey’s superagency research describes value shifting from single-silo savings to adaptability and innovation at scale McKinsey.
CT Labs addresses this by instrumenting workflows upfront, applying governance to knowledge, and giving finance and operations role-based views so both near-term efficiency and longer-term strategic gains are visible and auditable.
Step 1: Establish Your Baseline Metrics (Before Deployment)
Your ROI story lives or dies on baselines. Without pre-deployment data, you cannot credibly isolate AI’s impact, and finance will push back. Capture volumes, cycle times, error rates, and labor hours for target workflows before you switch anything on.
Start where measurement is strong. CFOs treat AI as strategic but still require measurable linkage to outcomes Richmond Fed CFO Survey. Use systems of record to export historical data. For support scenarios, benchmark ticket volumes, handle times, channels, FCR (First Contact Resolution), CSAT (Customer Satisfaction), and backlog, following practices used to assess AI in service operations Fin AI.
Build a plan by department, workflow, and timeframe. Define pre- and post-periods and hold steady-state windows for clean comparisons. Top performers reach 80 to 95% adoption in key functions, so include adoption in your baseline and target-setting Worklytics.
What to baseline and how to collect it
- Throughput: tasks or tickets per week. Pull from ITSM (IT Service Management), CRM, HCM (Human Capital Management).
- Time per task: handle time, wait time, resolution time. Use logs or time studies.
- Quality: error rates, rework share, FCR (First Contact Resolution), CSAT (Customer Satisfaction) or EX (Employee Experience) scores.
- Labor: hours per role per workflow and loaded labor rates for conversion to dollars.
- Change readiness: knowledge completeness and freshness to inform later ROI variance. A TEI (Total Economic Impact) analysis of an AI writing platform quantified value once baselines existed, enabling a 333% ROI and payback under six months Writer TEI.
Step 2: Implement the Three-Tier ROI Framework
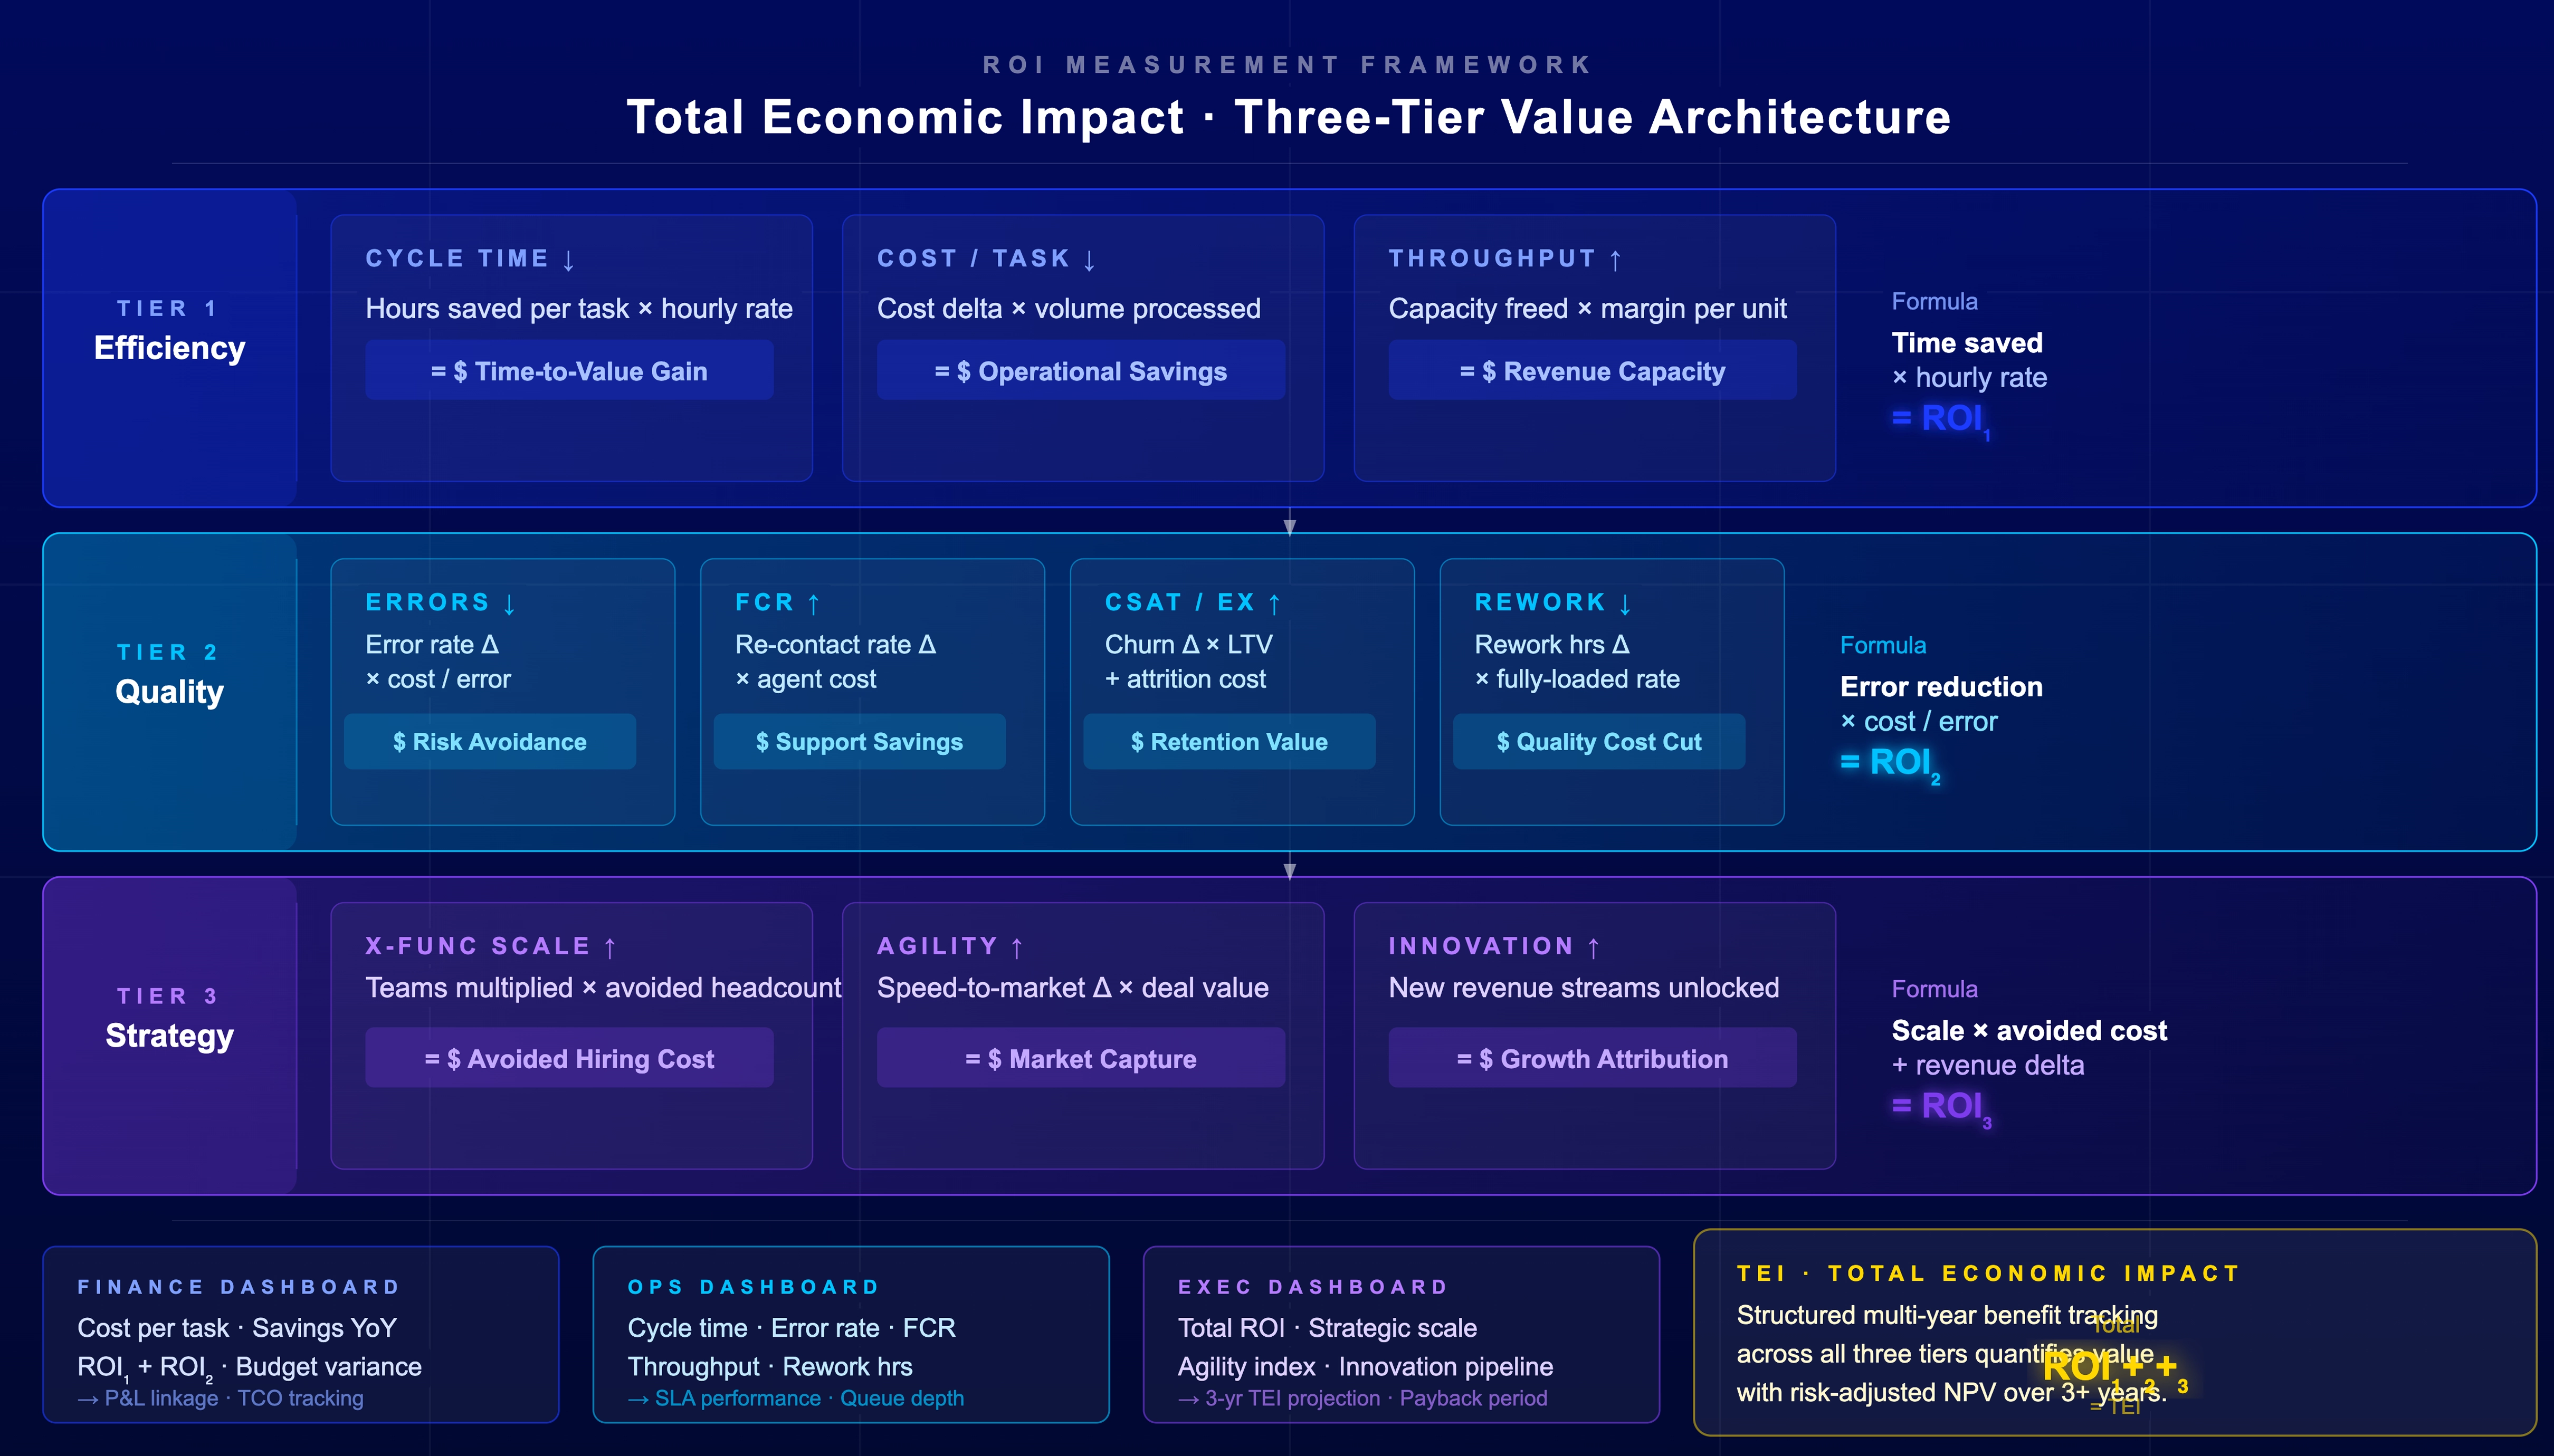
Measure across three tiers to capture near-term efficiency and long-term transformation. Finance prioritizes Tier 1, while executives look for Tier 3. Tie metrics to dollars in each tier, then roll up to a single ROI model.
- Tier 1, Operational efficiency: automation rate, tasks completed, time saved per employee, cost per task.
- Tier 2, Quality and experience: accuracy, error reduction, FCR (First Contact Resolution), rework, CSAT (Customer Satisfaction) and EX (Employee Experience).
- Tier 3, Strategic transformation: scalability across departments, agility, innovation capacity, speed-to-revenue.
Benchmarks show strong potential when measured this way. Service organizations report average returns of $3.50 for every $1 spent, and leaders can achieve higher gains Fin AI. Firms that get AI right report $3.70 per dollar invested Arcast.
A simple diagram you can use today
Tier 1, Efficiency: Cycle time ↓, cost per task ↓, throughput ↑ Tier 2, Quality: Errors ↓, FCR (First Contact Resolution) ↑, CSAT (Customer Satisfaction)/EX (Employee Experience) ↑, rework ↓ Tier 3, Strategy: Cross-functional scale ↑, agility ↑, innovation ↑
Tie each metric to dollars. Example: time saved × hourly rate. Error reduction × cost per error. Use role-based dashboards so finance, ops, and execs each see what they need. A TEI (Total Economic Impact) study shows how structured benefit tracking can quantify value over multiple years Writer TEI.
Step 3: Track the 5 Essential Metrics Your CFO Actually Cares About
Use standard formulas, then translate to dollars. Keep adoption visible because usage drives realized benefits.
- Automation rate: tasks handled by AI ÷ total tasks × 100. Pair with throughput.
- Cost per resolved task: total AI system cost ÷ AI-completed tasks. Include ongoing fees, which can add 10 to 30% annually Arcast.
- Employee time saved: hours saved × average hourly rate × headcount. Convert to FTEs to standardize for finance, as recommended by ROI practitioners Larridin.
- Accuracy and quality: error-rate reduction, FCR (First Contact Resolution) increase, rework reduction. Translate each avoided error to cost avoided.
- Adoption velocity: active users and usage frequency over time, since top performers reach 80 to 95% adoption in key functions Worklytics.
Worked examples, showing the math
Example 1, Cost per task: If monthly AI costs are 60,000 and AI resolves 12,000 tasks, cost per AI task is 60,000 ÷ 12,000 = 5. Compare to human cost per task using loaded hourly rates. Include 10 to 30% for ongoing maintenance and inference fees in your cost base Arcast.
Example 2, FTE hours saved: If an agent deflects 4,000 tickets per month and each ticket saves 6 minutes, time saved is 4,000 × 0.1 hour = 400 hours. At 70 per hour loaded, savings are 400 × 70 = 28,000 monthly. Convert 400 hours to roughly 0.24 FTE on a 1,680-hour work-year baseline Larridin.
Step 4: Calculate Your Actual ROI (With Real Numbers)
Use a single, auditable formula: ROI percent = (Total benefits − Total costs) ÷ Total costs × 100.
Break benefits into:
- Cost savings
- Productivity gains
- Quality improvements
- Revenue impacts (where appropriate)
- Risk impacts (where appropriate)
Break costs into:
- Software
- Implementation
- Training
- Change management
- Ongoing maintenance
- Compute
Hidden costs matter. Data preparation can account for 15 to 25% of total cost, and annual maintenance and inference fees can add 10 to 30% Arcast. Expectations remain strong, with average anticipated ROI at 171% among adopters PagerDuty.
Two illustrative calculations you can adapt
IT support scenario, illustrative: Benefits include time saved from deflection and faster resolution. Suppose 500 tickets per month are automated, each saving 8 minutes. Time saved is 500 × 0.133 hour = 66.5 hours. At 80 per hour loaded, monthly savings are 5,320. Add error-avoidance or escalations avoided where you have data. Costs include licensing, integration, and 15 to 25% for data prep plus 10 to 30% for ongoing maintenance and inference Arcast. Then compute ROI with the standard formula.
HR onboarding, illustrative: If AI completes 300 onboarding tasks monthly, each saving 12 minutes, time saved is 300 × 0.2 hour = 60 hours. At 60 per hour loaded, that is 3,600 per month. Add quality benefits if error rates drop. Subtract ongoing fees in your cost base, which adds 10 to 30% annually Arcast.
A quick benchmark table you can cite
Step 5: Account for the Knowledge Quality Multiplier
Knowledge quality is the biggest lever on ROI. When agents work from governed, complete, and current knowledge, returns rise. When they rely on fragmented content, errors and escalations dilute value.
Data-mature enterprises report two to three times higher productivity and financial returns than peers with low-trust knowledge Semarchy. That multiplier aligns with analyses showing strong ROI where data readiness and governance accompany the technology Arcast.
A quick readiness checklist
- Completeness: Do agents cover the top tasks and policies with authoritative sources?
- Accuracy and freshness: Are key documents versioned and current?
- Accessibility: Are permissions and retrieval patterns secure and reliable?
- Governance: Are updates reviewed, and are metrics observable over time?
CT Labs differentiates on a governed knowledge layer, evaluation and access patterns, and end-to-end observability so you can attribute ROI to specific knowledge improvements.
Step 6: Communicate Value to Different Stakeholders
Tailor the story to the audience. CFOs want standardized financial units and clear payback. Ops leaders want throughput, time, and quality. Executives want agility and scale.
Nearly two-thirds of CFOs in the U.S. view AI and automation as strategic, but they demand measurable linkage to outcomes Richmond Fed CFO Survey. Align each agent capability with metrics that roll up into financial value, a pattern used by leading frameworks in the market Moveworks.
Role-based reporting, practical tips
- Finance: Lead with cost per task, FTE-equivalent hours, and payback. Include ongoing costs of 10 to 30% for a complete TCO view Arcast.
- IT and operations: Show automation rate trends, backlog reduction, and error rates.
- Executives: Summarize scale across functions and agility gains, consistent with superagency practices McKinsey.
CT Labs provides stakeholder-ready reporting and dashboards mapped to these views.
Step 7: Avoid the 5 Most Common ROI Measurement Pitfalls
Most early failures come from timing and scope. Define windows that capture learning curves and track adoption carefully. Account for variable inference costs, not just licenses.
Two findings stand out. 95% of generative AI pilots failed to show bottom-line impact within six months, so measuring too early or only on short-term profit leads to false negatives UC Berkeley Exec Ed. Broadly, many AI projects miss intended value when judged with legacy metrics The Data Experts.
Five pitfalls and how to course-correct
- Measuring too early: Hold a 60 to 90 day stabilization window before declaring ROI.
- Ignoring adoption: Track active users and usage frequency. Low adoption caps value.
- Missing nondeterministic costs: Include token usage and variable reasoning cost bands of 10 to 30% in TCO Arcast.
- Over-focusing on cost cuts: Add productivity, quality, and strategic benefits.
- No benchmark alternative: Compare to status quo, staffing, and RPA.
If ROI lags, improve knowledge quality, expand high-signal use cases, and tighten observability on failure modes. CT Labs flags early-warning indicators through workflow telemetry and governance checks.
Step 8: Scale and Sustain ROI Over Time
ROI often improves with scale as fixed costs amortize and agents learn across workflows. Expand deliberately into adjacent processes and keep monthly metric reviews and quarterly optimizations.
Only a minority of organizations reach an expanding stage where AI is scaled across departments, yet those that do shift value toward adaptability and speed McKinsey.
A practical scaling pattern
- Prove value in one workflow with reliable baselines.
- Harden knowledge governance and evaluation.
- Add adjacent use cases with shared knowledge and access patterns.
- Standardize reporting, then expand to more functions.
CT Labs supports this with workflow-first design, security and access patterns, and observability that keep ROI visible as you scale.
Real-World ROI Examples from 2026 Deployments
Independent analyses highlight strong outcomes when benefits and costs are measured comprehensively. A Forrester TEI found a composite organization achieved a 333% ROI and a net present value of $12.02 million over three years, with payback under six months, by measuring content efficiency and quality improvements Writer TEI. In customer support settings, average returns of $3.50 per $1 invested have been reported when programs track both efficiency and quality Fin AI.
Illustrative cross-function calculations you can mirror
IT service desk, illustrative: If AI resolves 1,200 of 2,000 monthly tickets and saves 7 minutes each, time saved is 1,200 × 0.117 hour = 140.4 hours. At 85 per hour, monthly savings are 11,934. Add avoided escalations if tracked. Subtract data preparation at 15 to 25% of total cost and ongoing 10 to 30% fees Arcast.
Finance operations, directional: Intellectyx highlights reduced manual processing time across finance and supply chain use cases, which you can translate into time and error-avoidance dollars when baselines exist Intellectyx. Apply the same ROI formula and cost components.
Your ROI Measurement Checklist and Next Steps
Use this as your operating manual. Keep it short, measurable, and auditable.
Pre-deployment:
- Confirm workflows
- Export 6 to 12 months of baseline data
- Map knowledge sources
- Define metrics per tier
- Align finance on FTE and error-cost conversions
- Document cost components including data prep and maintenance bands of 10 to 30% Arcast
First 90 days:
- Instrument adoption and usage frequency
- Track automation rate and cost per task weekly
- Log error reductions
- Collect CSAT (Customer Satisfaction) and EX (Employee Experience) shifts
- Review inference cost variance monthly
Ongoing:
- Monthly metric reviews
- Quarterly business reviews with role-based summaries
- Annual strategy reset tied to cross-functional scaling

Frequently Asked Questions About Measuring Agentic AI ROI
How long to see positive ROI?
While some tools show payback under six months, many pilots do not show bottom-line impact that quickly, so set a longer window and measure quality and strategic gains too UC Berkeley Exec Ed Writer TEI.
What if finance only cares about cost savings?
Convert time saved into FTE hours and dollars using agreed rates to standardize productivity into financial terms Larridin.
How do I measure qualitative benefits like morale?
Use proxy metrics with baselines, such as EX (Employee Experience) scores, retention, and voluntary turnover. Tie improvements to error reduction and time saved where possible.
Does ROI vary by department?
Yes, and it can vary widely. Service and back-office functions often show strong returns when tracked against both efficiency and quality Fin AI.
What is a realistic first-year automation rate?
It varies by process and knowledge readiness. Track adoption velocity closely since top-performing companies reach 80 to 95% adoption in key functions Worklytics.
How do I account for change management and ongoing costs?
Include data prep at 15 to 25% and ongoing maintenance and inference at 10 to 30% in your TCO model Arcast.
Should customer-facing and internal agents be measured differently?
Yes. For customer-facing, include cost per resolved interaction and CSAT (Customer Satisfaction). For internal, focus on time saved, accuracy, and capacity unlock.
How does CT Labs compare?
Our focus on governed knowledge and observability aligns with research showing 2 to 3 times higher returns for data-mature enterprises Semarchy.
Conclusion
You can prove agentic AI ROI when you combine strong baselines, a three-tier measurement model, and CFO-grade conversion of outcomes into dollars. Use the standard ROI formula, include hidden costs like data prep and ongoing inference, and treat knowledge quality as a multiplier. The data shows both the upside and the risks: high anticipated ROI when measured broadly, and frequent early-stage false negatives if you judge too soon or too narrowly PagerDuty UC Berkeley Exec Ed.
Next steps: finalize your baseline plan, stand up the five CFO metrics with automated collection, and run monthly reviews. CT Labs can help you deploy agents with governance, observability, and built-in ROI dashboards so you can scale confidently. Contact us to request the ROI calculator, measurement worksheet, and stakeholder report templates.
Disclaimer: ROI varies based on implementation quality, knowledge readiness, and organizational factors. Always validate assumptions with your own baselines and finance-approved rates.